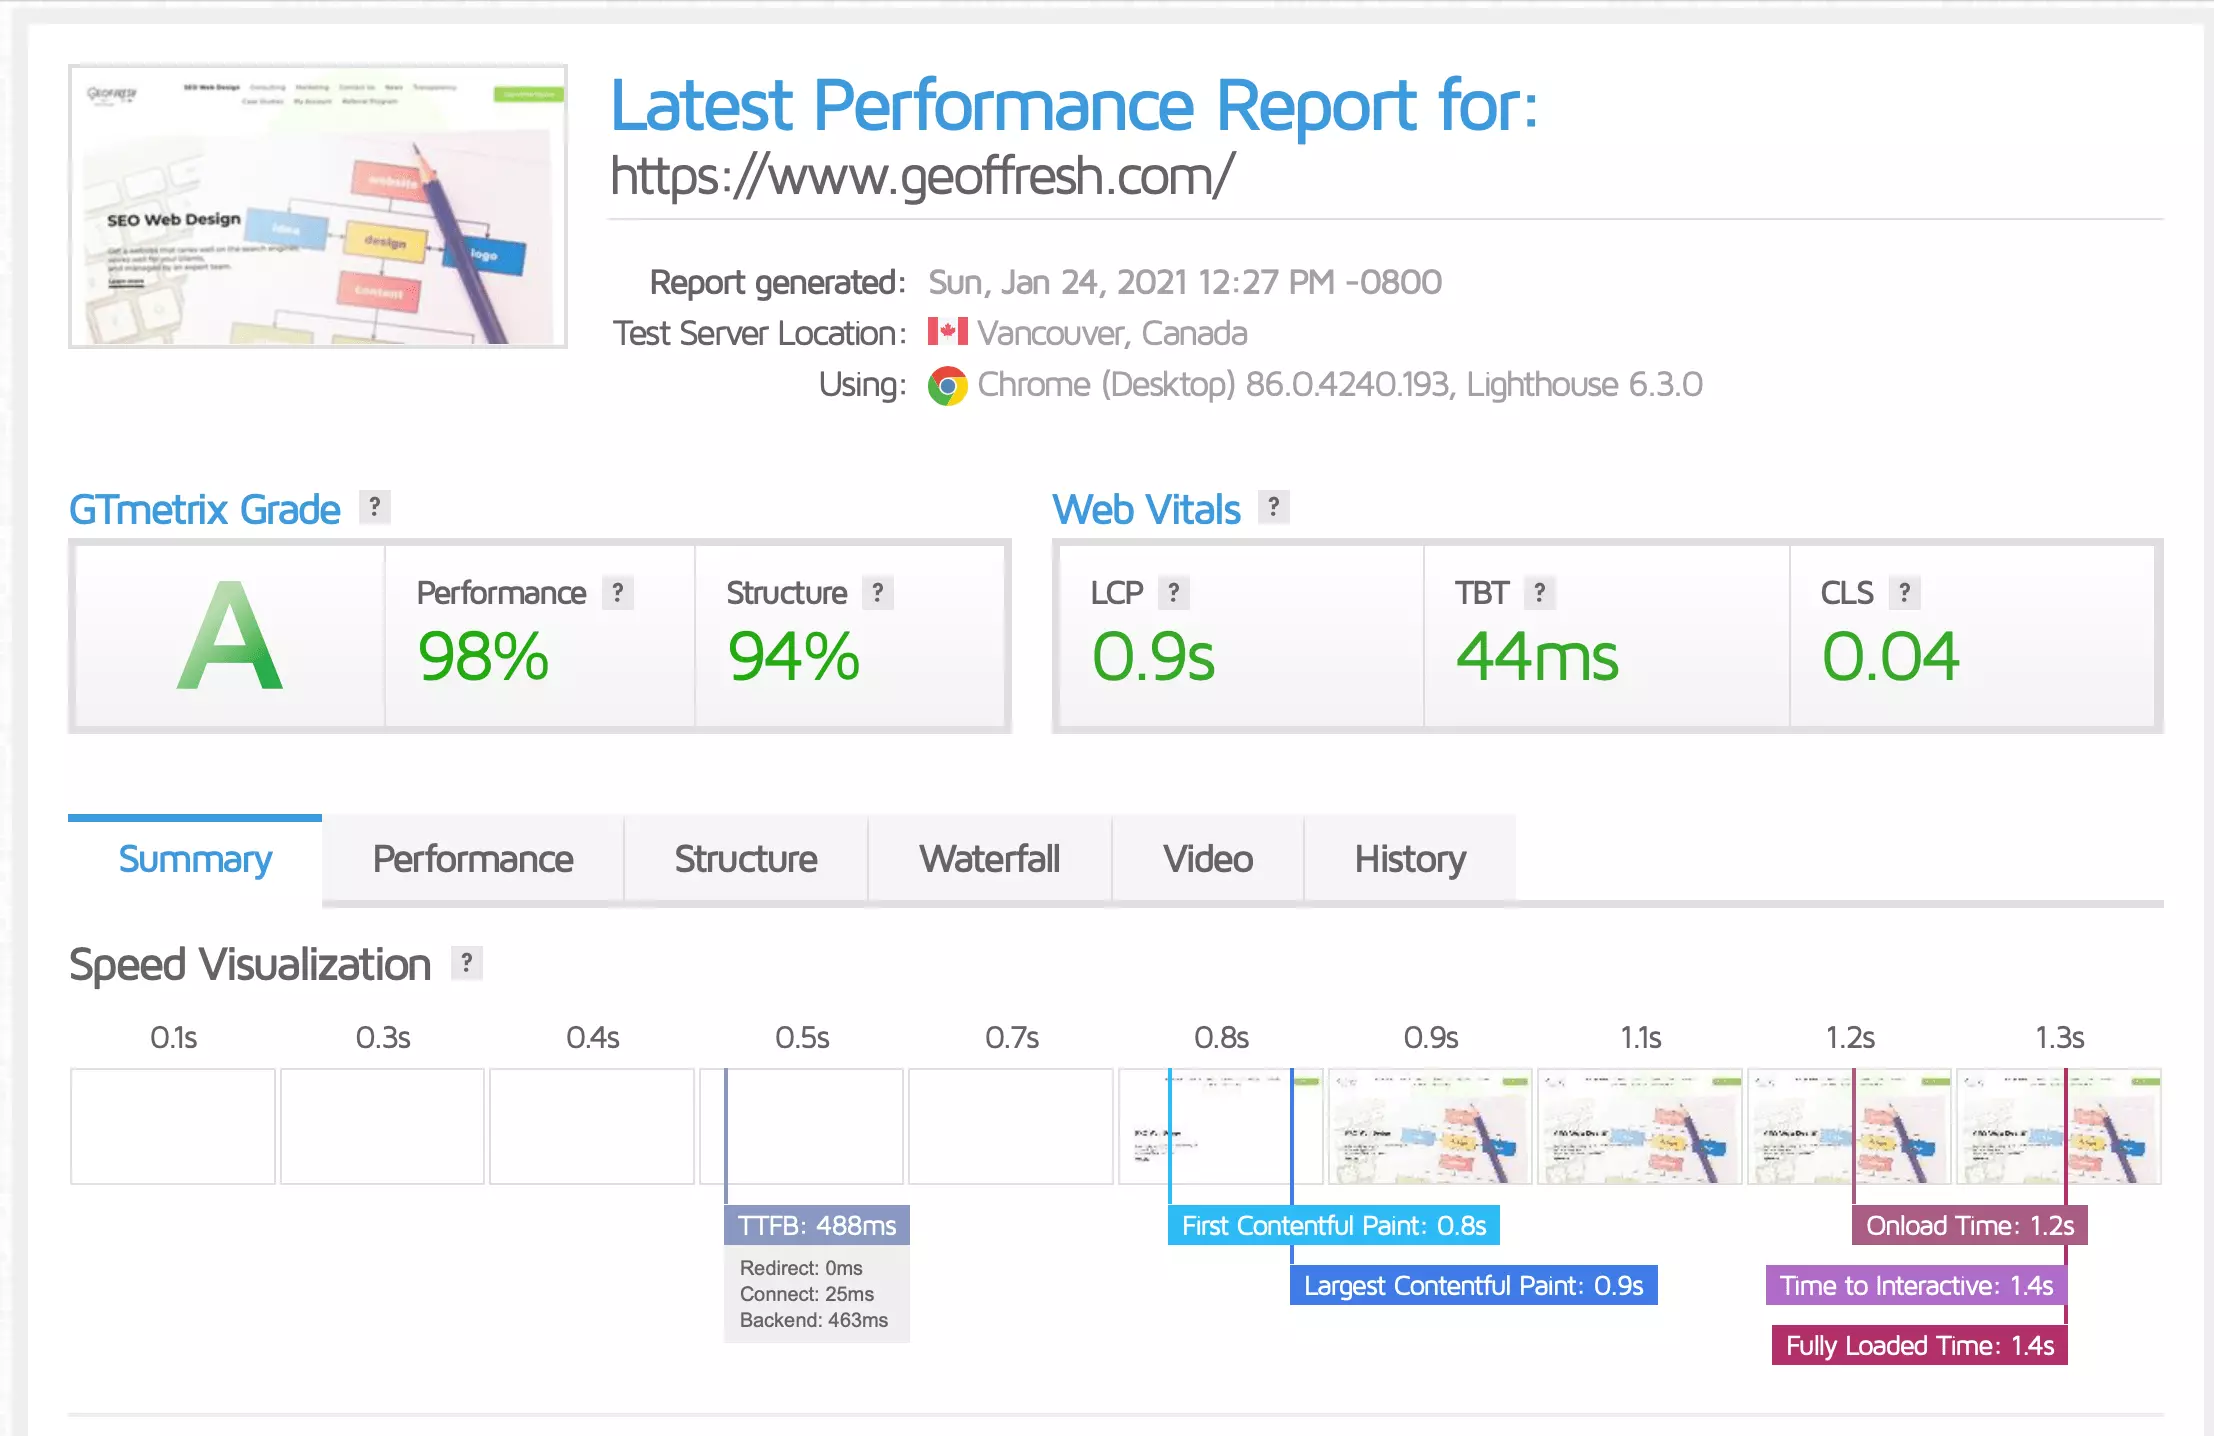
We are happy to see one of our favorite tools GTMetrix get a much needed overhaul!
For quite some time, we have used GTMetrix and Pingdom to do quick checks on websites. Over the years and through many search engine updates, we have seen these tools go from useful, to nit-picky as not all optimizations apply to the current website.
What Changed in GTMetrix lately?
One of the concerns that we have had with the previous GTMetrix version is that the optimization recommendations are so broad that even a very fast loading site could rank low on their scale. However, now they moved over to using Lighthouse as their performance algorithm. If you used the previous version, you might go down rabbit holes and run into the danger of over optimizing your website. With the new system, they use the Lighthouse performance metric as well as a few other items that make more sense for today's websites and search engines.
GTMetrix Performance Metric
This metric uses the Lighthouse score. In addition to that, GTMetrix also uses their custom audits that take into account hardware and browser options. By taking this into account, you can get a more accurate look into how your website is performing. Having a high percent in this metric is better.
GTMetrix Structure Metric
This metric is custom to GTMetrix. It is based upon their custom audit and contains tests like:
- Connection Keep-alive
- CSS Sprites
- CDN test
- CSS @Import checks
Similar to the performance metric, having a high percent is better. Check out our result, we're at a 94%!

GTMetrix LCP Metric
The LCP or Largest Contentful Paint is a measure of how long it takes to "paint" the largest image on a page in order for the page to become visible to your users. The largest image usually is the hero image on the page but sometimes if there is not an image, then it will be the heading text or other large element in the viewport. Having a low value on this is preferable (best to be below 1.2 seconds).
GTMetrix TBT Metric
TBT or Total Blocking Time is the total time that your page rendering has been blocked by waiting for scripts on your page to load. You want to ensure that your scripts are optimized and are loading efficiently so your visitors are not waiting on a large JavaScript file for your website to become interactive. You want this number to be low (below 150ms).
GTMetrix CLS Metric
Lastly we come to CLS or Cumulative Layout Shift. This is a critical one for websites to be more responsive and elements can move around a page. This ensures you have a website that can work on mobile, desktop, and tablet environments. One issue you want to keep your eye on is if your website loads some elements quickly, and when a user wants to interact with a button, they attempt to click it but miss as the button moves down since the page is still loading unbeknownst to the user. GTMetrix has a great visualization of bad CLS —and you have probably seen this before. Having a low CLS below 0.1 is advised.
So we are happy that GTmetrix has made these changes and updated their audits. It will make optimization so much more clear to web teams!
